The federal budget includes a vast array of programs in hundreds of agencies. But when boiled down, the budget consists of just five basic spending activities: compensating federal workers, purchasing goods and services, giving aid to state and local governments, transferring wealth through subsidy and benefit programs, and paying interest on the federal debt.
The federal government spent $3.9 trillion in 2013, according to the Bureau of Economic Analysis (BEA).1 Transfers were the largest spending activity at $1.98 trillion, followed by purchases at $571 billion, aid to the states at $510 billion, interest at $414 billion, and compensation at $407 billion.2
Federal Spending Activities
Transfers to individuals and businesses account for 51 percent of federal spending. Some of the largest benefit and subsidy programs are Social Security, Medicare, food stamps, refundable tax credits, unemployment insurance, farm subsidies, and supplemental security income.
Purchases account for 15 percent of spending. The government buys everything from fighter jets to computers and paper clips. Defense activities account for 63 percent of purchases and nondefense for 37 percent.
Aid to the states accounts for 13 percent of spending. It is delivered through more than 1,100 programs for health care, highways, education, housing, and many other things.3 Medicaid is the largest aid-to-state program.
Interest accounts for 11 percent of spending. This BEA measure of interest is somewhat larger than the net interest measure in the federal government’s budget.
Compensation (wages and benefits) for 3.7 million defense and nondefense federal workers accounts for 10 percent of spending. Defense workers (uniformed and civilian) account for 60 percent of federal compensation costs and nondefense for 40 percent.4
Spending Trends
Figure 1 shows federal spending since 2000 for the four noninterest activities. Transfers are the largest and fastest-growing activity. Since 2000, transfers have grown at an annual average rate of 6.7 percent, which compares to purchases at 6.0 percent, compensation at 5.5 percent, and aid to the states at 5.0 percent. Total federal spending grew at 5.5 percent during this period, while the consumer price index grew at just 2.4 percent.
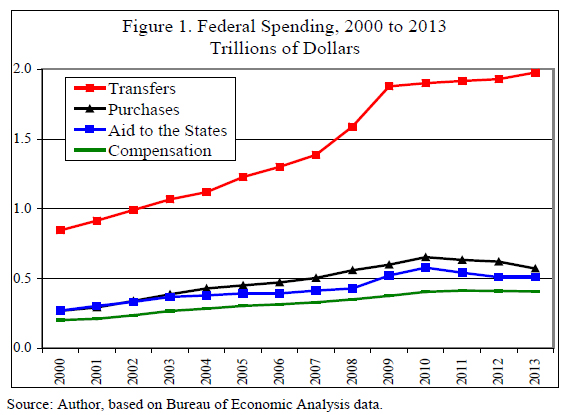
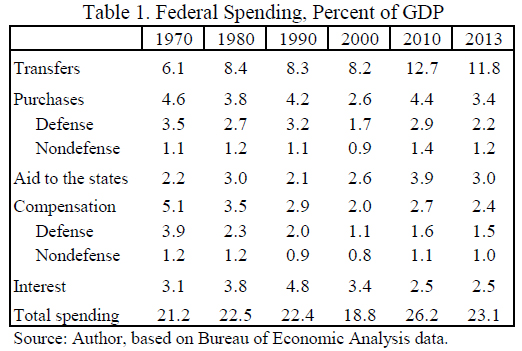
Table 1 shows spending by activity back to 1970 as a percent of gross domestic product (GDP). Transfers almost doubled as a share of GDP from 6.1 to 11.8 percent. Defense purchases have fallen, but nondefense purchases have been stable. Aid to the states has edged up. Defense compensation has fallen, while nondefense compensation has been roughly flat. Overall spending has risen sharply as a share of GDP since 2000.
Four Ways to Cut Spending
Official projections show huge federal budget deficits and ever rising debt in coming decades. Without reforms, the non-stop red ink will undermine economic growth and reduce living standards. As such, policymakers should scour the budget for programs and activities to cut.
1. Transfers. Transfers can create a mirage that the government is generating a cost-free flow of income to the public. However, every dollar of spending comes from taxes on someone, either now or in the future.
So transfers are a zero-sum game. Actually, they are worse than that for two reasons. First, they reduce the productive efforts of taxpayers, discouraging them from working, saving, investing, and starting businesses. Second, they reduce the productive efforts of recipients, discouraging them from earning income in the market economy.
With fewer productive efforts, the economy shrinks and incomes fall. Consider Social Security. The system’s payroll tax harms the labor market and reduces jobs. Meanwhile, the system’s retirement benefits suppress personal savings and induce earlier retirement. Reforms should transform Social Security into a system of private accounts because that would spur added working and saving, and thus increase economic growth.
Keynesian economists claim that spending on transfer programs is good for the economy, but the reverse is true. Government spending causes distortions. It makes people change their behavior in ways that undermine growth.
2. Aid to the States. Federal aid is an inefficient way to fund state and local activities. It encourages overspending by the states, comes with complex federal regulations that stifle innovation, and generates bureaucracies at all levels of government.5 Americans would have more frugal, transparent, and responsible government if aid programs were eliminated. There are no advantages of funding state and local activities with federal dollars, but there are many disadvantages to the economy and to sound governance.
3. Purchases. Federal procurement has long been subject to waste and scandal. Contracts for defense, energy, and technology projects often go over budget, for example.6 Defense dominates federal procurement and should be subject to more vigorous oversight.
A general downsizing of the government would cut purchasing costs. Policymakers should cut low-priority weapon systems; end activities that should be done by the private sector such as energy research and passenger rail; and sell many of the 365,000 federal buildings that are scattered across the nation.7
4. Compensation. In 2012 average wages and benefits for federal civilian workers were $114,976, or 74 percent more than the average for U.S. private-sector workers of $65,917.8 Federal benefits are particularly out of line with the private sector. A good place to save taxpayer money would be to scale back federal pension benefits.
Conclusions
The U.S. Constitution does not create an open-ended role for the federal government to transfer wealth or aid the states. Yet today those two activities account for about two-thirds of federal spending. So transfers and aid should be the focus of major cuts.
However, there is also much waste and unneeded spending within the government’s purchasing and compensation activities. Given the huge size of the government’s fiscal problems, policymakers should make cuts to all types of spending.
1 All figures in this bulletin are calendar year data from the Bureau of Economic Analysis, National Income and Product Accounts, Tables 3.2, 3.9.5, 3.10.5, and 5.11. See www.bea.gov/iTable/index_nipa.cfm.
2 Total federal spending in this bulletin is BEA “total expenditures.” I have defined spending activities as follows: transfers include transfer payments, less aid to the states, plus subsidies, plus capital transfers (other than state aid); purchases include intermediate goods and services purchased, plus gross investment, less some minor adjustments; aid to the states includes capital transfers to the states.
3 Chris Edwards, “Fiscal Federalism,” www.DownsizingGovernment.org, June 2013.
4 This data excludes the U.S. Postal Service.
5 Chris Edwards, “Fiscal Federalism,” www.DownsizingGovernment.org, June 2013.
6 Chris Edwards, “Government Cost Overruns,” www.DownsizingGovernment.org, March 2009.
7 General Services Administration, “Federal Real Property Report,” Fiscal Year 2012.
8 Chris Edwards, “Overpaid Federal Workers,” www.DownsizingGovernment.org, August 2013.