News outlets are running stories about the rise in corporate tax inversions. Inversions are financial reorganizations that place U.S. firms under foreign parent corporations. They are one of the many ways that companies are responding to America’s uniquely high corporate tax rate.
Liberal policymakers and pundits are outraged by inversions because they fear that the government will be starved of revenues. Treasury Secretary Jacob Lew has demanded new rules to stop inversions because “allowing these transactions to continue, we run the risk of eroding our corporate tax base and undoing the progress we have made to reduce our budget deficits.”
However, it is our high 40 percent tax rate that is eroding our corporate tax base. If we chopped the rate substantially, tax avoidance would fall and U.S. investment would rise. Over time, more income would be reported to the government, with the result that the government would probably not lose any money, and it could even gain some. Governments, businesses, and workers would all win from a corporate tax rate cut.
Here is some evidence that the government would win. For 19 OECD countries for which there is good data back to the 1960s, I plotted the average corporate tax rates and average corporate tax revenues. The chart illustrates the Laffer effect of cutting high statutory tax rates on a very mobile tax base.
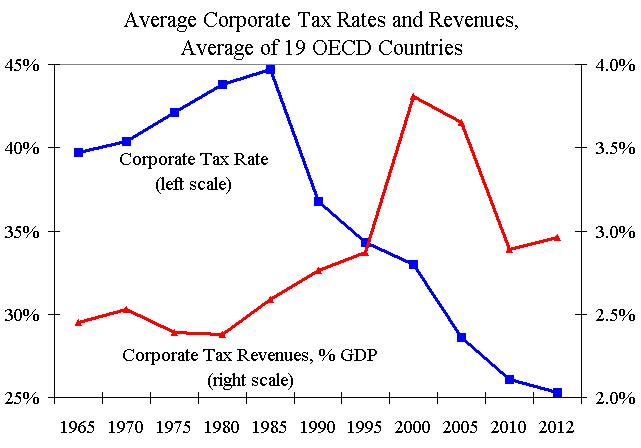
Between the mid-1960s and mid-1980s, many countries had corporate tax rates of 40 percent or more. Governments in the 19 countries collected an average 2.5 percent of GDP from corporate taxes during those years.
Then came the Thatcher-Reagan tax-cutting revolution, and corporate tax rates began falling everywhere. Between 1985 and 2012, the average rate for the sample of 19 countries fell from 45 percent to 25 percent.
Did governments in these countries collect less revenue after that huge rate cut? The opposite occurred: corporate tax revenues soared during the 1990s and 2000s. Revenues did fall during the recent recession, but they are now starting to climb again. Even in the depths of the recession, average corporate tax revenues were still higher than they were prior to the beginning of the rate-cutting revolution in the 1980s.
For more on inversions, see my recent NYT article. For more on the mobility of corporate profits in the global economy, see Global Tax Revolution.
Data Notes:
- OECD corporate tax revenue data is here. For three countries with missing 2012 data, I proxied the values with the 2011 figures.
- OECD corporate tax rate data is available back to 1981. I have used the central government rates only because I have not found a good source for subnational (state/provincial) rates for years prior to the OECD data.
- For this reason, the revenues (which include subnational governments) and the rates (which do not) are not an exact match, but that is not a big problem for the purpose of showing the rate/revenue trends over time.
- The 19 countries included in chart calculations are: Australia, Austria, Belgium, Canada, Denmark, Finland, France, Germany, Greece, Ireland, Italy, Japan, Luxembourg, Netherlands, New Zealand, Spain, Sweden, United Kingdom, and the United States.
Themes: